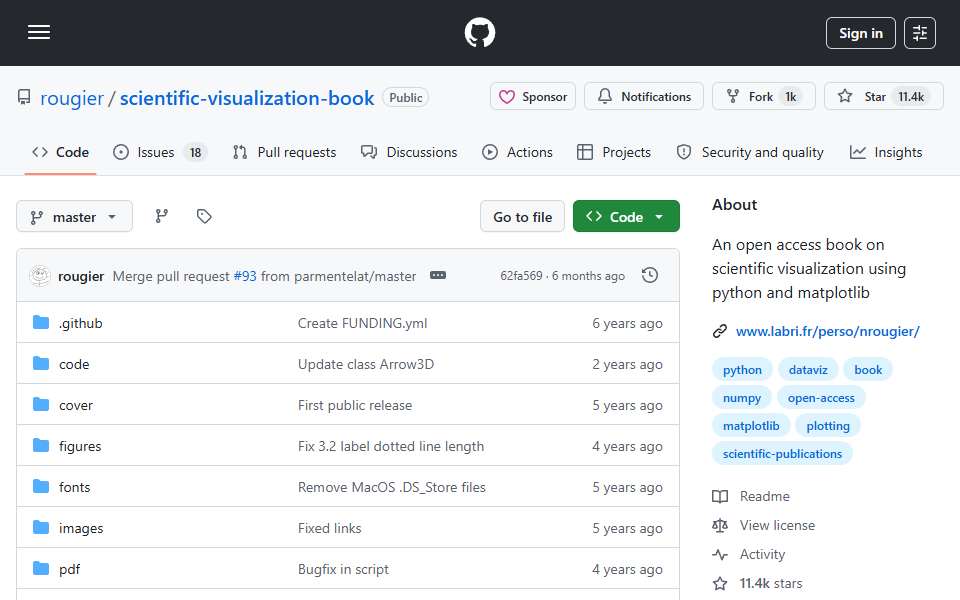
An open access book on scientific visualization using Python and Matplotlib
Report a link problem
Submission timeline
2007–2026One slot for every year since HN launched. Height is that year's peak points; orange marks a 100+ point or 50+ comment breakout. Select a bar to open its strongest thread.
Top comments
This person is prolific and has a ton of great tutorials, free books, and more in their repo (I like the numpy book: https://www.labri.fr/perso/nrougier/from-python-to-numpy/). Major thanks to the author for sharing all this knowledge.
I work with chemical and materials companies on full stack data capabilities and interactive viz / dashboarding is a recurring pain point. Frequently there are larger scale processes (beyond a single engineer’s or scientist’s scope) that still require scientific-level interactive viz that the likes of PowerBI or Tableau can’t (or won’t?) provide… if your company even has a subscription. Things like being able to dynamically re-group/nest variables and recalculate statistical tests, dual axis capabilities…
The first top-level comment from each of the four biggest threads, in HN’s own order. Excerpts are shortened; open a comment for full context.
HN stats
- Breakout years
- 2
- Total points
- 489
- Total comments
- 89
100+ points or 50+ comments
reference only — not used in Hall rules or ranking
reference only — not used in Hall rules or ranking
Every submission
| Date | Title as submitted | By | Points | Comments |
|---|---|---|---|---|
| 2021-11-15 | An open access book on scientific visualization using Python and MatplotlibFirst breakout · Best thread | sebg | 309 | 35 |
| 2024-02-13 | Scientific Visualization: Python and Matplotlib | nabla9 | 3 | 0 |
| 2024-09-17 | Scientific Visualization: Python + Matplotlib (2021)Latest 20+ point return | danso | 177 | 54 |